






















Conceptual Foundations of the Water Footprint: Components, Scope, and Application in Water Management
* By Juan Diego Rodriguez Triana
In an era of global environmental strain, efficient resource management dictates aquaculture sustainability. Juan Diego Rodriguez Triana establishes the conceptual foundations of the aquaculture water footprint. By decomposing usage into blue, green, and gray components, this analytical framework maps direct farm consumption alongside indirect supply chain pressures, offering stakeholders a robust, lifecycle-based tool to maximize water-use efficiency and protect local watersheds.
In a global context marked by increasing pressure on water resources, efficient water management has become a determining factor for the sustainability of productive systems, especially in aquaculture.
This sector depends directly on the availability and quality of water resources, not only as the physical medium for cultivating aquatic organisms, but also as an element that conditions productivity, animal health, welfare, and the relationship between the production system and surrounding ecosystems. In this context, the water footprint emerges as a key indicator for understanding not only how much water is used, but also how, where, and with what impacts it is utilized throughout the value chain.
The application of the water footprint in aquaculture systems makes it possible to reveal dynamics that have traditionally been addressed only partially, such as water abstraction and recirculation, evaporation losses, effluent discharges, pollutant loads associated with farming activities, and the indirect use of water embedded in inputs such as feed, energy, and other materials required for production.
The water footprint quantifies freshwater volumes used per product unit or system. It is tied to virtual water, illustrating how trade implicitly transfers resource pressures from consuming territories to producing regions worldwide.
In this way, the analysis is not limited to the volume of water present in ponds, raceways, cages, or recirculating systems, but rather incorporates a broader perspective on the water pressures generated directly and indirectly by aquaculture activities.
This article establishes the conceptual foundations necessary to understand the water footprint as an analytical and management tool in aquaculture systems, addressing its main components, the distinction between direct and indirect water footprints, and the concept of virtual water.
Based on this approach, the aim is to provide a theoretical framework that facilitates the interpretation of results and supports decision-making processes aimed at improving water-use efficiency, reducing impacts on water bodies, and strengthening the environmental sustainability of a growing sector that is increasingly demanding in productive, sanitary, and environmental terms.
Water Footprint
The water footprint is an indicator that quantifies the volume of freshwater used to produce a good, provide a service, or sustain the consumption of a person, community, company, or country. Depending on the objective of the analysis, it may be expressed per unit of product, per hectare, per monetary unit, or for an entire system.
The concept is closely related to that of virtual water, understood as the volume of water incorporated directly and indirectly into the production of goods and services that are subsequently traded or consumed elsewhere. From this perspective, when a product is exchanged, the water required to produce it is also implicitly transferred.
The notion of virtual water was an important foundation for the subsequent development of the water footprint approach, as it highlighted how consumption and trade can shift water pressures from consuming territories to producing territories.
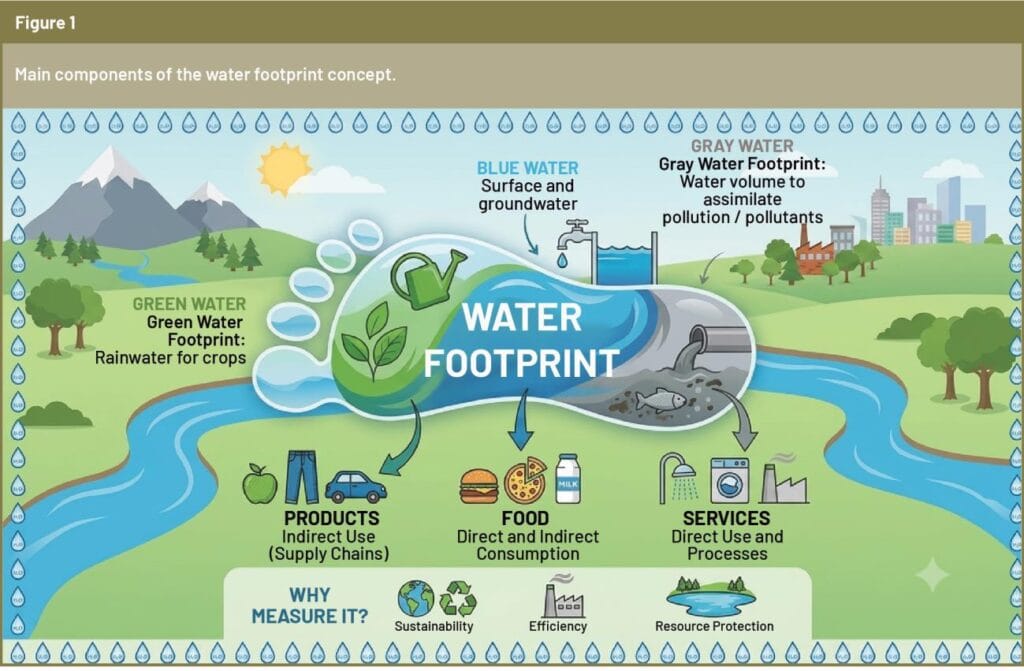
The blue footprint measures surface and groundwater consumption via evaporation or incorporation. Conversely, the green footprint tracks soil-stored rainwater evapotranspired by crops, reflecting indirect water use embedded in commercial aquaculture feeds.
However, the water footprint should not be interpreted solely as an isolated volumetric value. Its significance depends on the hydrological and territorial context in which water use occurs. The same volume may have very different implications depending on whether it is associated with a water-abundant basin or a region affected by scarcity, competition among users, or water quality degradation. Therefore, the water footprint is most useful when interpreted together with information on water availability, seasonality, resource quality, and ecosystem requirements.
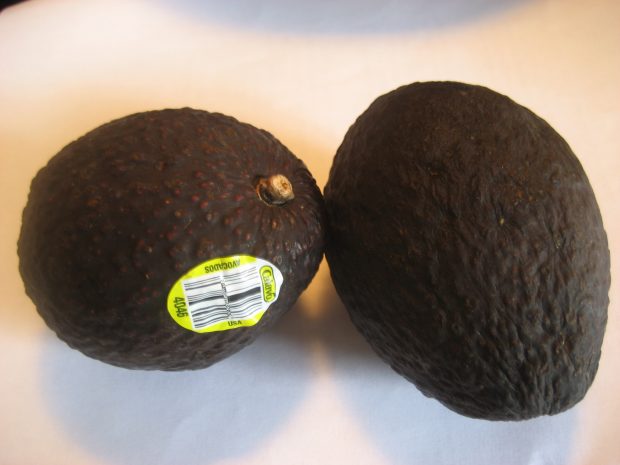
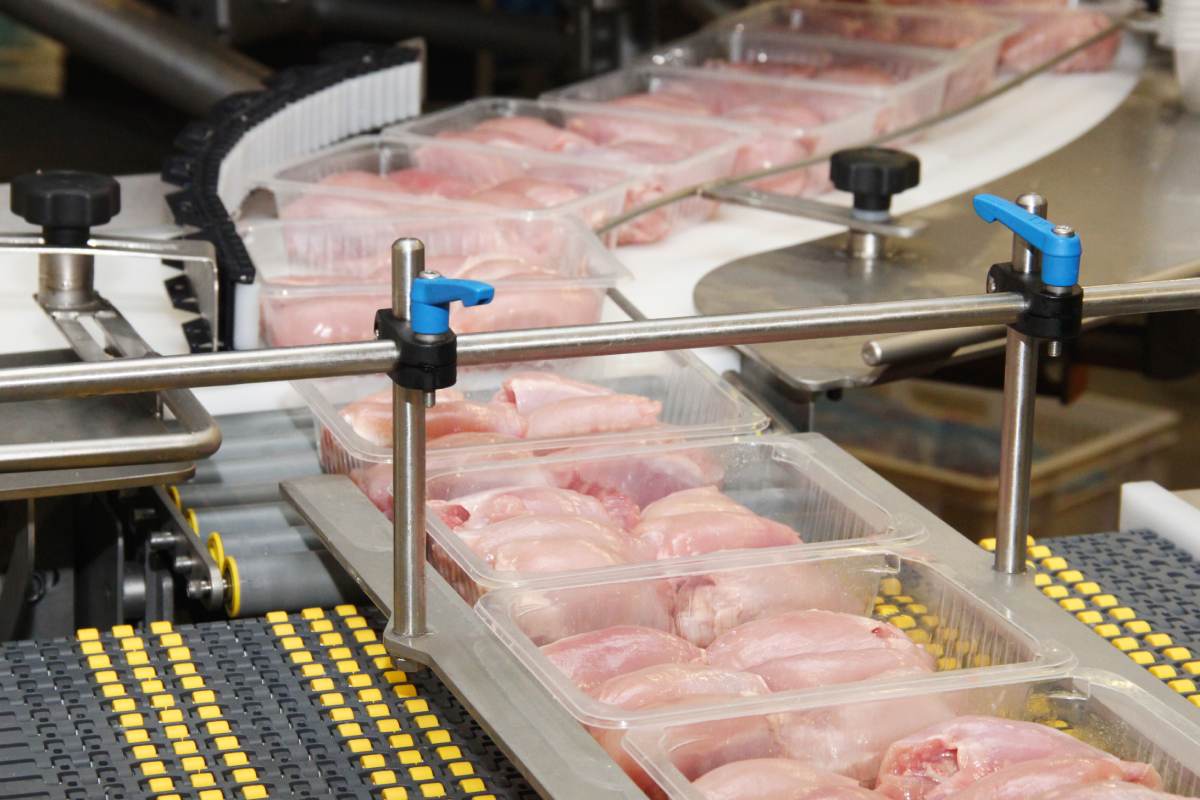
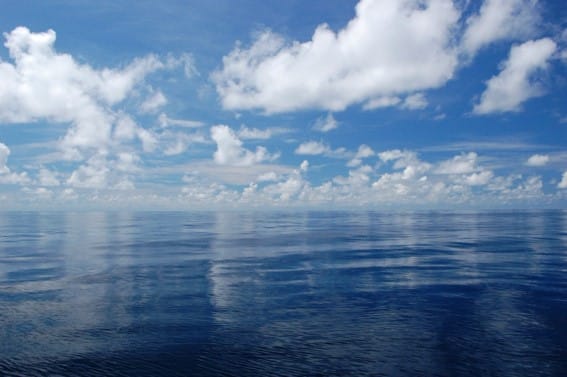
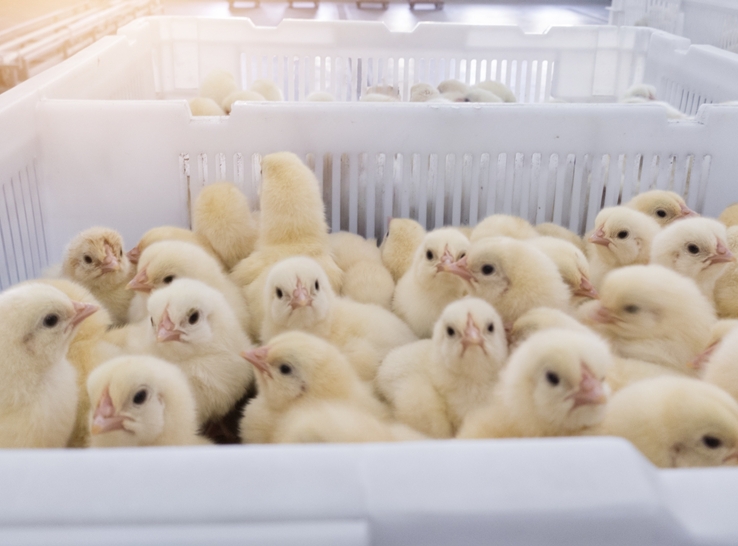
Conceptually, this approach is divided into three main components: blue water footprint, green water footprint, and gray water footprint (Figure 1).
Blue water footprint
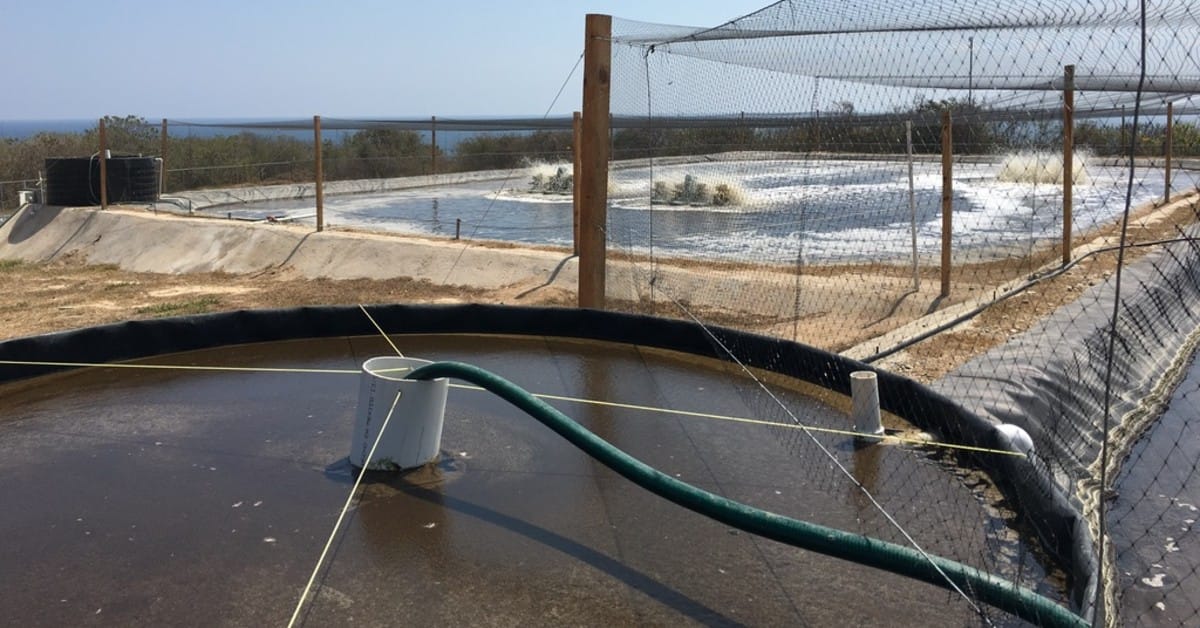
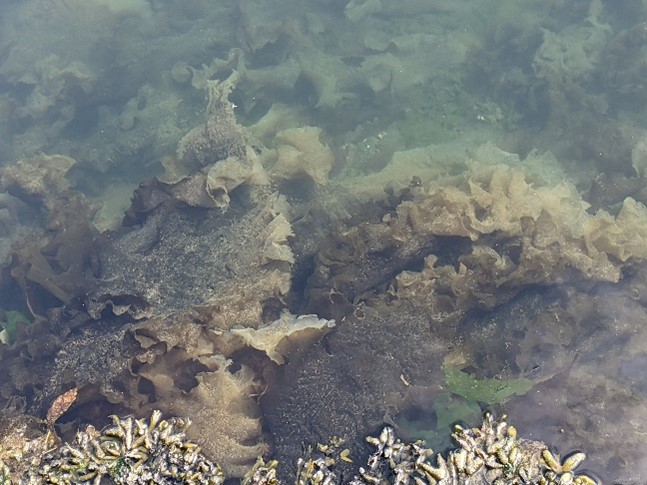
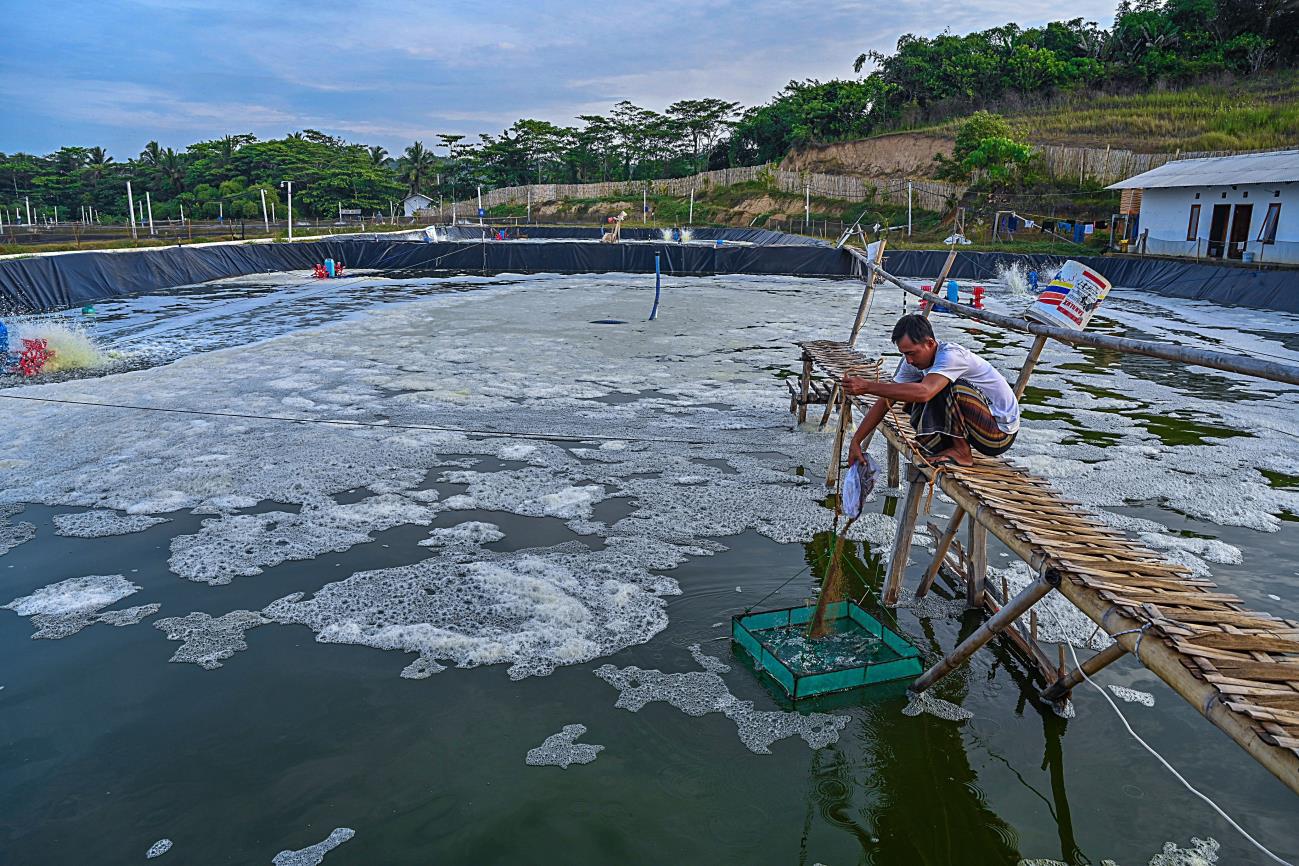
The blue water footprint corresponds to the consumption of freshwater originating from surface or groundwater bodies, that is, from rivers, lakes, reservoirs, and aquifers, which does not return to the same basin at the same place and time, either because it evaporates, becomes incorporated into the product, is transferred to another basin, or returns at a time different from that required by the hydrological system (Figure 2). In aquaculture, this component mainly includes water used for pond filling and exchange, facility cleaning, hydraulic transport, and replacement of losses caused by evaporation or infiltration.
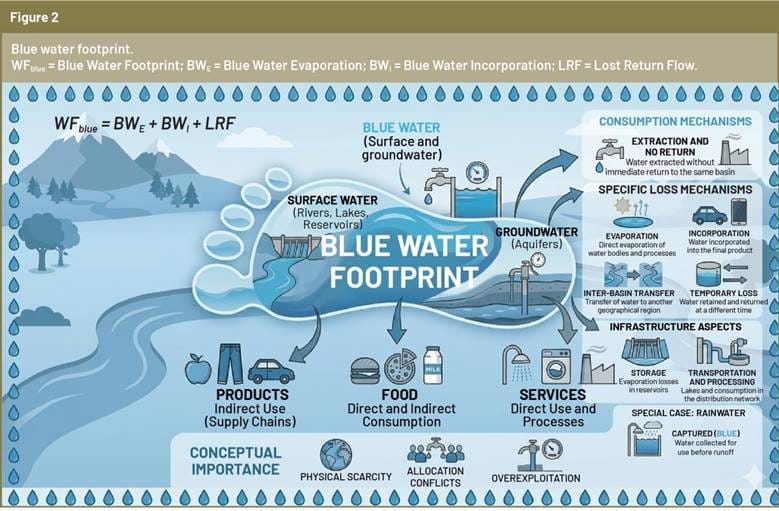
Evaporation is usually the dominant loss component, especially in extensive and semi-intensive aquaculture systems due to the large exposed surface areas. Nevertheless, all relevant loss mechanisms should be considered, including those associated with water transport, processing, and disposal.
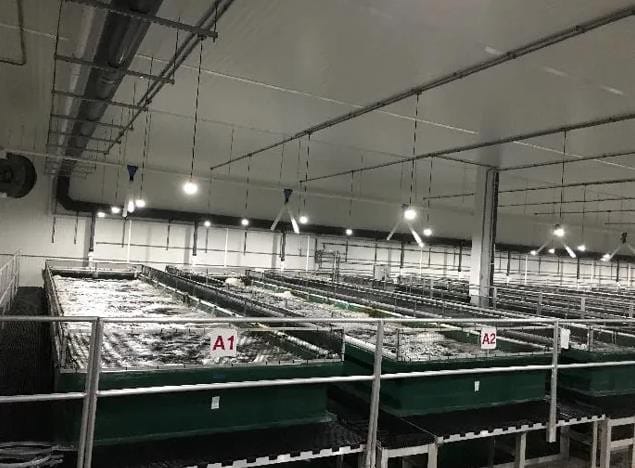
In intensive aquaculture systems, reductions in the blue water footprint have been supported by technologies such as Recirculating Aquaculture Systems (RAS) and Biofloc Technology (BFT), which significantly reduce water exchange through internal reuse. RAS employ mechanical and biological filtration processes to remove suspended solids and transform nitrogen compounds, while BFT systems rely on microbial communities to recycle nutrients and convert nitrogen into biomass that can be utilized by cultured organisms.
The gray water footprint represents the theoretical freshwater volume required to assimilate pollutant loads, such as ammonia, phosphorus, and biochemical oxygen demand, ensuring receiving water bodies maintain acceptable local quality standards.
From a productive perspective, the blue water footprint is the dimension most closely associated with physical water scarcity, allocation conflicts, and overexploitation of water sources. Its relevance, however, depends not only on the extracted volume but also on local water availability and the environmental requirements of the watershed.
A particular case is harvested rainwater: if it is collected and used before becoming runoff, it is generally accounted for as blue water footprint; if it remains in the soil and is used by vegetation, it corresponds to green water footprint. This distinction is important because it shows that the classification of the same resource depends not only on its origin, but also on how it is integrated into the production process.
Direct footprints quantify visible operational use within the aquaculture farm. Indirect footprints capture upstream supply chain impacts, including feed manufacturing, input processing, and energy production, demanding a comprehensive lifecycle assessment perspective.
Green water footprint
The green water footprint corresponds to the use of rainwater stored in the soil and available to plants, which is subsequently evapotranspired or incorporated into biomass (Figure 3). This component is particularly important in agricultural, forestry, and livestock systems that depend on soil moisture derived from precipitation.
Unlike the blue water footprint, the green footprint does not necessarily imply direct abstraction from rivers or aquifers, but it does represent the appropriation of water available within the territory to sustain biological production. In aquaculture, this appears as an indirect green water footprint associated with the production of agricultural ingredients used in balanced feeds, such as corn and soybeans, whose growth depends significantly on rainfall.
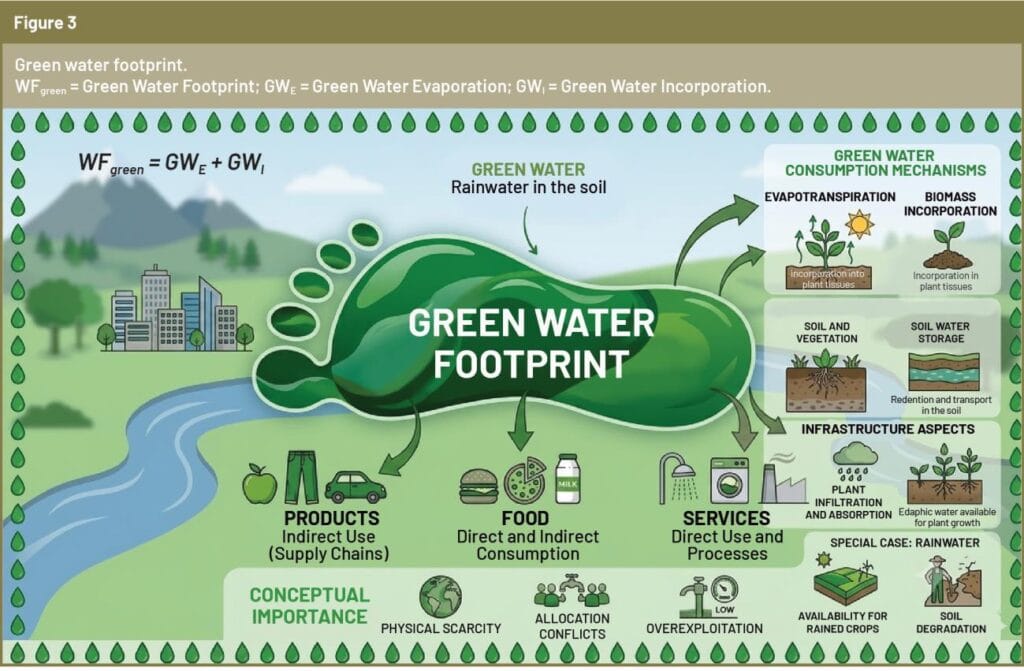
The incorporation of the green water footprint was a decisive contribution of the water footprint approach, as it broadened the traditional perspective focused solely on abstracted or artificially distributed water. Conceptually, it recognizes that a significant part of agricultural and livestock production depends on natural water flows that also possess ecological and productive value.
However, its interpretation requires caution, since the use of green water does not automatically imply the absence of impacts. Changes in land cover, soil management, or productive expansion may alter rainfall partitioning, infiltration, runoff, and other relevant ecological processes.
Gray water footprint
The gray water footprint represents the theoretical volume of freshwater required to assimilate a pollutant load until a specified water quality standard is met (Figure 4). It does not represent physically consumed water, but rather the volume needed to dilute or absorb pollutants so that the final concentration remains within acceptable limits. This component integrates the relationship between production and water quality deterioration, including both point-source discharges and diffuse inputs such as runoff or leaching.
In aquaculture, this component is closely related to the discharge of nutrients, organic matter, and suspended solids originating from uneaten feed, feces, nitrogenous metabolites, and products used in sanitary management. The main compounds associated with the gray water footprint include ammonia nitrogen, nitrites, nitrates, phosphorus, and biochemical oxygen demand (BOD).
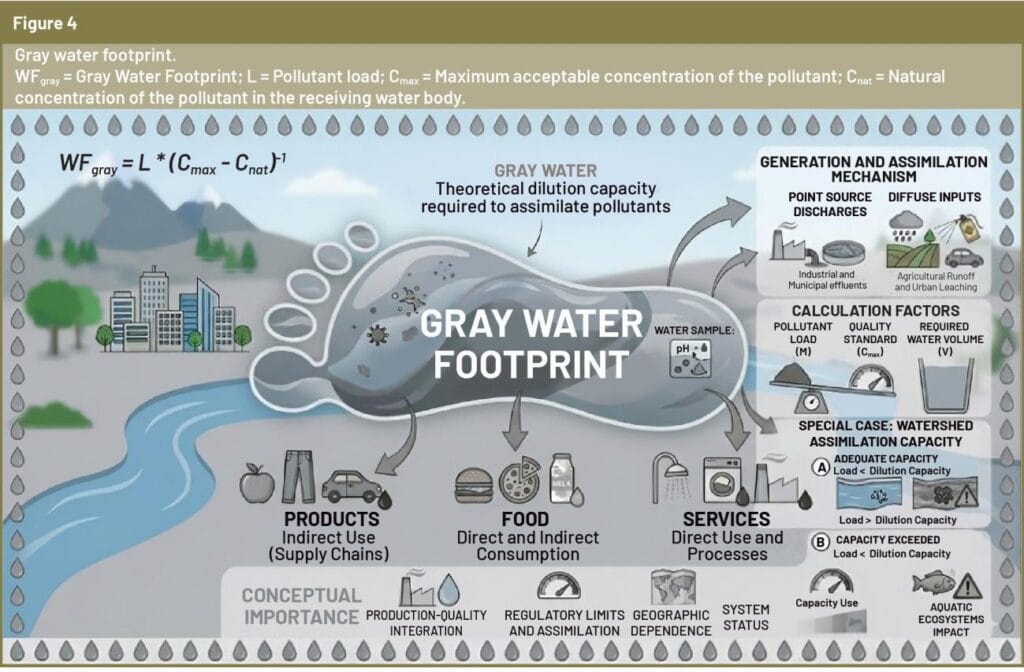
The gray water footprint depends directly on local conditions, since both natural concentrations and water quality standards may vary among watersheds and types of water bodies. For this reason, the same pollutant load may generate different gray water footprint values depending on the geographical context.
A value greater than zero for this parameter does not necessarily imply non-compliance with regulations, but rather indicates the use of part of the assimilative capacity of the system. However, when this indicator exceeds the water availability of the receiving body, it demonstrates that the pollutant load surpasses its dilution capacity.
Direct and Indirect Water Footprint
In addition to being analyzed according to its blue, green, and gray components, the water footprint can also be assessed according to the location within the value chain where water use or resource appropriation occurs. Under this approach, a distinction is made between direct and indirect water footprints, two complementary dimensions that allow for a more comprehensive understanding of the water dependency of aquaculture systems.
The direct water footprint corresponds to water used within the aquaculture production unit and associated with the system’s own operations, representing the visible and operational use of water resources within the aquaculture farm.
In contrast, the indirect water footprint comprises water used in upstream stages and throughout the aquaculture supply chain. In this case, the main contribution is generally related to the production of balanced feed, especially through the cultivation of agricultural raw materials, whose production incorporates significant volumes of water, particularly green water. Additionally, the indirect footprint includes water associated with the manufacturing of inputs, energy production, transportation, infrastructure, and other services required by the production system.
The true potential of water footprint metrics depends on local hydrological contexts. Assessing volumetric data alongside seasonal availability, resource quality, and ecosystem requirements helps operations improve efficiency and mitigate localized environmental impacts.
This distinction is particularly relevant in aquaculture because most water pressure does not occur at the visible point of consumption, but rather upstream in the production chain, particularly in feed manufacturing. Therefore, an analysis limited solely to direct consumption may considerably underestimate the system’s actual dependency on water resources and their associated impacts; consequently, a holistic assessment requires a life-cycle perspective rather than an operational on-site measurement.
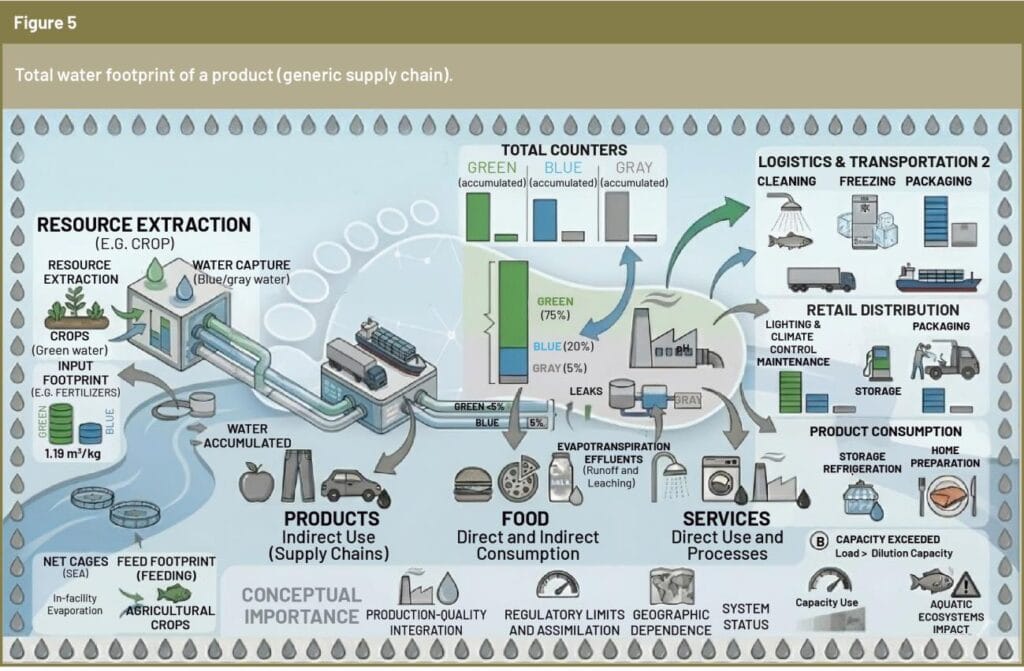
Analytically, it is important to emphasize that the direct and indirect categories do not replace the blue, green, and gray categories. Rather, they are complementary dimensions. The first classification indicates the type of water used or the pressure generated; the second indicates at which stage of the value chain that appropriation or impact occurs. Thus, an indirect footprint may simultaneously include blue, green, and gray components, just as a direct footprint may (Figure 5).
Conclusion
The water footprint constitutes a comprehensive tool for understanding the relationship between aquaculture and water resources, enabling the simultaneous assessment of water consumption, appropriation, and pollution throughout the production chain. Its application in aquaculture systems is particularly relevant because water acts not only as an input, but also as the primary biological support for production.
The distinction between blue, green, and gray water footprints, as well as between direct and indirect footprints, provides a robust analytical framework for studying the water dependency of goods, services, and territories. However, its true potential emerges when these components are interpreted according to local context, water availability, water quality, and the ecological conditions of watersheds.
* Juan Diego Rodriguez Triana
Clima Soluciones SAS Coordinador
Phone: +57 3219782480
Bogotá, Colombia
Apa Reaksi Anda?
 Suka
0
Suka
0
 Kurang Suka
0
Kurang Suka
0
 Setuju
0
Setuju
0
 Tidak Setuju
0
Tidak Setuju
0
 Bagus
0
Bagus
0
 Berguna
0
Berguna
0
 Hebat
0
Hebat
0