



















The Infrastructure Behind Ten Years of Impact

Ten Years In: What the PMI Program Taught Us About Building Poultry Systems That Last
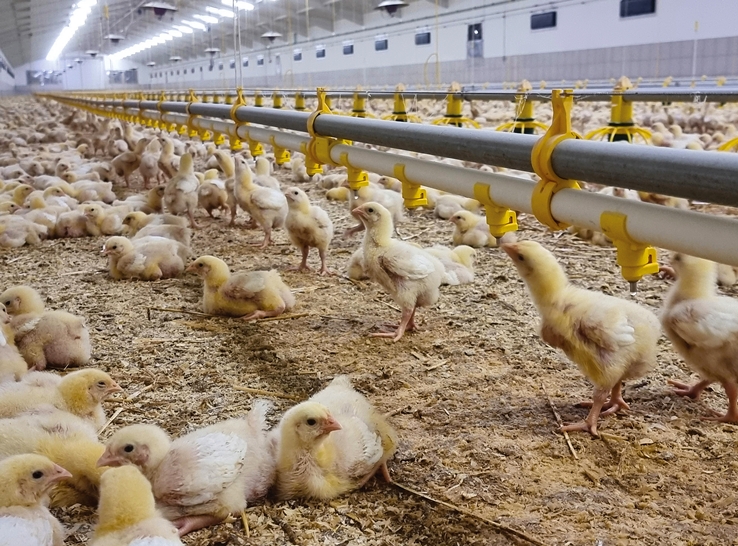
The Poultry Multiplication Initiative (PMI) is World Poultry Foundation’s (WPF) flagship program model, a private-sector-led approach that builds self-sustaining poultry value chains in rural communities. At its core, the model works through a simple chain: hatcheries produce day-old chicks, Brooder Units raise them for four to six weeks, and small-scale producers purchase those teen birds to grow for eggs and meat. Each link in the chain is a real business generating real income and that commercial logic is what makes the model durable long after WPF’s direct involvement ends.
Central to the PMI model is the dual-purpose poultry (DPP) bird, a breed positioned between commercial breeds and local indigenous chickens. DPP birds grow faster than village chickens, produce more eggs, and thrive in low-input rural environments. Introducing this breed into new markets, and building the value chains to support it, is the work of the PMI program. It sounds straightforward. In practice, it rarely is.
A decade into the PMI, the WPF team has learned more from the unexpected than from anything that went according to plan. We asked team members across programs, finance, data, and field operations to share the challenges they didn’t see coming and what those challenges ultimately changed about how we work. This is part two of a three-part series on unanticipated challenges and opportunities in the PMI program over the last ten years. In this installment, we look at how the program measures, learns, and adapts through data systems and financial oversight.
By: Thierry Binde, Tokozile Ngwenya, and Earl Pearce
Part 2: The Infrastructure Behind Ten Years of Impact – How the program measures, learns, and adapts through data systems and financial oversight.
A program can be well-designed and well-delivered and still fail to learn from itself. The team members in this installment work in data and analytics, and what they found, consistently, is that the quality of information flowing through a program is just as important as the quality of the work happening in the field.
Data tells you what happened. Farmers tell you why.
 For MEL Analyst Thierry Binde, the most valuable lesson of the last several years has come from learning to read two datasets at once.
“CommCare gave me strong operational visibility,” he says. “But when I listened directly to farmers through the pulse survey, I found discrepancies between the system data and the voice of the farmer.” Activities were being recorded, but farmer feedback sometimes pointed to gaps in how support was actually being experienced on the ground.
The insight prompted a shift in how data is used across the program from reporting to learning. “I became more deliberate about building a data-use loop: collect, review, interpret, discuss, act, and verify,” Thierry says. “A dashboard is only useful when people trust it, understand it, and have a structured space to use it.”
His approach now combines Power BI analysis with regular pulse survey review. “We do not rely only on one dataset or one indicator. We compare routine monitoring data, pulse survey insights, and field realities before drawing conclusions.”
The broader lesson, he says, is deceptively simple: “Data systems do not create learning by themselves. Learning happens when routine data, farmer voice, and program judgment are brought into the same conversation.”
Clean data doesn’t happen by accident.
Data quality starts in the field and WPF’s CommCare Coordinator Tokozile Ngwenya has seen what happens when that foundation isn’t secure.
One of the biggest data quality challenges was duplicate farmer registrations: FSRs entering the same farmer multiple times under slightly different name spellings or phone numbers. The effects compounded quickly. Farmer progress became difficult to track as farmer flock records could not be linked to a single farmer. Reporting became fragmented. The same farmer’s production and participation could appear under different profiles, making it nearly impossible to tell their story accurately.
The response was both technical and cultural. New validation rules were built into CommCare, prompting FSRs to check whether a farmer already exists before registering. But Tokozile was clear that technology alone wasn’t the answer. “Training alone is not enough. Ongoing reminders, mentorship, and reinforcement in the field are just as important.”
A related issue emerged around flock closures. Many FSRs weren’t formally closing flocks in CommCare after the birds had been sold or lost because from their perspective, once the birds were gone, there was no reason to return and record the outcome. The result was a significant gap in the program’s ability to show actual sales prices, income generated, and farmer success.
“When we explained why flock closure data matters, not just for reporting, but for demonstrating impact, compliance improved significantly,” Tokozile says. “Good data systems rely not just on technology, but on people, behaviours, and habits.”
The numbers don’t sit still
For MEL Analyst Thierry Binde, the most valuable lesson of the last several years has come from learning to read two datasets at once.
“CommCare gave me strong operational visibility,” he says. “But when I listened directly to farmers through the pulse survey, I found discrepancies between the system data and the voice of the farmer.” Activities were being recorded, but farmer feedback sometimes pointed to gaps in how support was actually being experienced on the ground.
The insight prompted a shift in how data is used across the program from reporting to learning. “I became more deliberate about building a data-use loop: collect, review, interpret, discuss, act, and verify,” Thierry says. “A dashboard is only useful when people trust it, understand it, and have a structured space to use it.”
His approach now combines Power BI analysis with regular pulse survey review. “We do not rely only on one dataset or one indicator. We compare routine monitoring data, pulse survey insights, and field realities before drawing conclusions.”
The broader lesson, he says, is deceptively simple: “Data systems do not create learning by themselves. Learning happens when routine data, farmer voice, and program judgment are brought into the same conversation.”
Clean data doesn’t happen by accident.
Data quality starts in the field and WPF’s CommCare Coordinator Tokozile Ngwenya has seen what happens when that foundation isn’t secure.
One of the biggest data quality challenges was duplicate farmer registrations: FSRs entering the same farmer multiple times under slightly different name spellings or phone numbers. The effects compounded quickly. Farmer progress became difficult to track as farmer flock records could not be linked to a single farmer. Reporting became fragmented. The same farmer’s production and participation could appear under different profiles, making it nearly impossible to tell their story accurately.
The response was both technical and cultural. New validation rules were built into CommCare, prompting FSRs to check whether a farmer already exists before registering. But Tokozile was clear that technology alone wasn’t the answer. “Training alone is not enough. Ongoing reminders, mentorship, and reinforcement in the field are just as important.”
A related issue emerged around flock closures. Many FSRs weren’t formally closing flocks in CommCare after the birds had been sold or lost because from their perspective, once the birds were gone, there was no reason to return and record the outcome. The result was a significant gap in the program’s ability to show actual sales prices, income generated, and farmer success.
“When we explained why flock closure data matters, not just for reporting, but for demonstrating impact, compliance improved significantly,” Tokozile says. “Good data systems rely not just on technology, but on people, behaviours, and habits.”
The numbers don’t sit still
 For Data Analyst, Earl Pearce, the surprise wasn’t in the field. It was in the spreadsheet.
Coming from the commercial broiler breeder side of the industry, Earl was used to working with clean, consistent and complete data: flocks visited every week, performance tracked by age, analysis possible at the flock level with reliable regularity. DPP field data works very differently.
“Visits are irregular,” he says. “Essentially you get snapshots of what happened based on a best guess for the past week. You don’t get every age. It’s not always the same day of the week. Brooder Units are visited more often, but they’re only on the farm for four to six weeks. SSPs are visited only a few times across their entire lifespan because there are simply so many flocks.”
The result is that meaningful analysis has to happen at a higher level, averaging across common ages, relying on regression after removing outliers, and looking at the same indicator across multiple definitions. You have to work with what’s there rather than what a cleaner system might provide.
“My initial response was a little panic,” Earl admits. “And then I thought, this is going to be one of the most analytically challenging, and exciting, problems I’d worked on and it continues to be.”
What ten years actually looks like.
A decade in, the PMI model works because the people behind it built the tools to know when it wasn’t. What Thierry, Tokozile, and Earl have each described is the infrastructure that makes that learning possible: systems that catch problems early, and data that can give a clear picture of what is happening on the ground.
What hasn’t changed is the fundamental logic: build private-sector poultry value chains that generate real income, improve nutrition, and continue to grow long after WPF’s direct involvement ends. Getting there requires exactly what this team has built, not just good programs, but good systems for knowing whether those programs are working.
For Data Analyst, Earl Pearce, the surprise wasn’t in the field. It was in the spreadsheet.
Coming from the commercial broiler breeder side of the industry, Earl was used to working with clean, consistent and complete data: flocks visited every week, performance tracked by age, analysis possible at the flock level with reliable regularity. DPP field data works very differently.
“Visits are irregular,” he says. “Essentially you get snapshots of what happened based on a best guess for the past week. You don’t get every age. It’s not always the same day of the week. Brooder Units are visited more often, but they’re only on the farm for four to six weeks. SSPs are visited only a few times across their entire lifespan because there are simply so many flocks.”
The result is that meaningful analysis has to happen at a higher level, averaging across common ages, relying on regression after removing outliers, and looking at the same indicator across multiple definitions. You have to work with what’s there rather than what a cleaner system might provide.
“My initial response was a little panic,” Earl admits. “And then I thought, this is going to be one of the most analytically challenging, and exciting, problems I’d worked on and it continues to be.”
What ten years actually looks like.
A decade in, the PMI model works because the people behind it built the tools to know when it wasn’t. What Thierry, Tokozile, and Earl have each described is the infrastructure that makes that learning possible: systems that catch problems early, and data that can give a clear picture of what is happening on the ground.
What hasn’t changed is the fundamental logic: build private-sector poultry value chains that generate real income, improve nutrition, and continue to grow long after WPF’s direct involvement ends. Getting there requires exactly what this team has built, not just good programs, but good systems for knowing whether those programs are working.
Thierry Binde leads a data training for Field Service Representatives.
Earl Pearce meets with a Field Service Officer during a farmer visit in Zambia.
The post The Infrastructure Behind Ten Years of Impact appeared first on World Poultry Foundation.
Apa Reaksi Anda?
 Suka
0
Suka
0
 Kurang Suka
0
Kurang Suka
0
 Setuju
0
Setuju
0
 Tidak Setuju
0
Tidak Setuju
0
 Bagus
0
Bagus
0
 Berguna
0
Berguna
0
 Hebat
0
Hebat
0

Edusehat
Platform Edukasi Online Untuk Komunitas Kesehatan Agar Mendapatkan Informasi Dan Pengetahuan Terbaru Tentang Kesehatan Dari Nasional Maupun Internasional. ||
An online education platform for the health community to obtain the latest information and knowledge about health from both national and international sources.