





















Aquaculture and Overfishing: What FAO Data and Peer-Reviewed Science Say About The New York Times’ Claims
Editorial Staff │ Aquaculture Magazine
Editorial analysis of the article published online by The New York Times Magazine on October 8, 2026 and in The New York Times on October 25, 2026, based on FAO statistics and peer-reviewed literature.
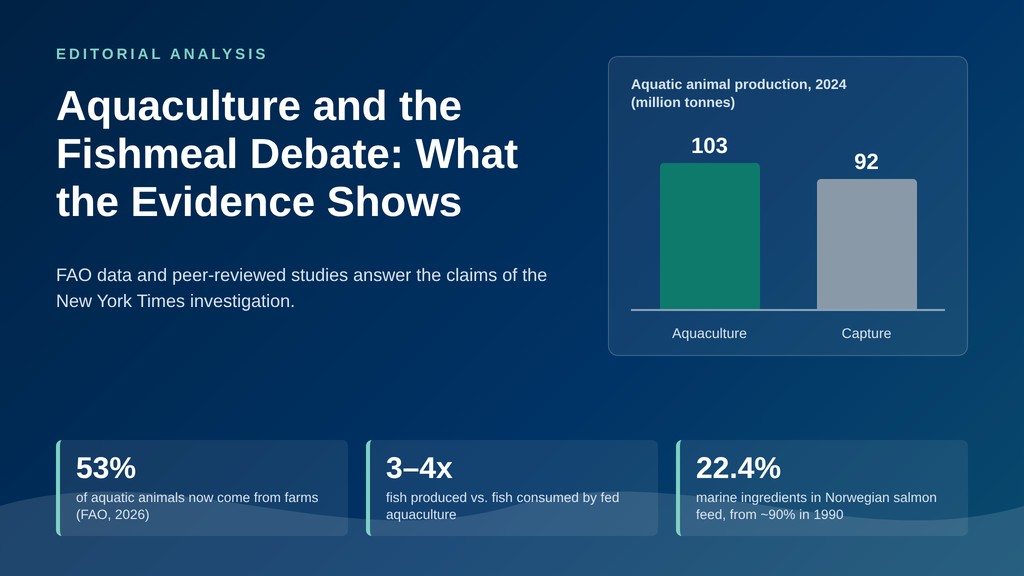
The New York Times argues that aquaculture is worsening overfishing. FAO data show that farms now supply 53% of the world’s aquatic animals while wild catch has stayed flat, and peer-reviewed studies document three decades of falling dependence on wild fish for feed.
On October 25, 2026, The New York Times carried “A Sea of Trouble,” part of journalist Ian Urbina’s investigation into the global fishmeal trade, first published online by The New York Times Magazine on October 8 as “The Dirty Secret Behind the Farmed Fish You Eat.” Its central thesis is that aquaculture, presented as relief for overfished oceans, is in fact making overfishing worse.
The reporting documents real abuses on fishing vessels and around fishmeal plants, and those abuses deserve scrutiny. The step from “some fishmeal supply chains are abusive” to “aquaculture is accelerating ocean depletion,” however, is not supported by the evidence. The article relies on worst-case examples, outdated conversion ratios and statistics presented without the context that changes their meaning. It omits two decades of peer-reviewed research and the United Nations’ own production figures.
This matters because the article does not stop at criticizing an industry. It tells consumers that eating farmed seafood makes them participants in an environmental crisis. That advice, if followed, would steer people away from one of the most efficient and nutritious sources of animal protein available. The sections below take the article’s main claims one by one and set each against the scientific record.
Claim 1: Aquaculture is making overfishing worse
What the article says. Because many farmed species are fed fishmeal and fish oil made from wild fish, the article argues that aquaculture deepens, rather than relieves, the pressure of overfishing. It supports this with the statistic that one-third of the world’s fish stocks are harvested at unsustainable levels.
What the evidence shows. According to FAO’s State of World Fisheries and Aquaculture 2026, aquaculture produced a record 103 million tonnes (Mt) of aquatic animals in 2024, 53% of the world total, while capture fisheries supplied 92 Mt. Wild capture has plateaued at around 90 Mt for three decades. Practically all growth in aquatic food supply since the 1990s has come from farms. Had that demand been met from the sea, wild stocks would face pressure far greater than anything attributable to fishmeal.
The one-third figure is accurate but incomplete. The same FAO report shows that 62.4% of monitored marine stocks were fished within biologically sustainable levels in 2023, and that 72.6% of global landings came from sustainable stocks. The difference exists because the largest fisheries, including the main reduction fisheries, tend to be the most intensively managed.
Hilborn et al. (2020), in the Proceedings of the National Academy of Sciences (PNAS), assembled trends for scientifically assessed stocks that account for about half of the reported global marine catch. On average, abundance in those stocks was increasing and sat at or near target levels. Regions with weak management showed roughly three times higher harvest rates and half the abundance. The overfishing the article describes is a problem of fisheries governance in specific regions, not an inherent property of fish farming.
Wild capture has stayed near 90 million tonnes for three decades. Practically all growth in the world’s supply of aquatic food since then has come from farms.
Claim 2: A farmed salmon eats several times its weight in wild fish
What the article says. The investigation states that, at some farms, a salmon consumes more than six times its own weight in wild-caught fish before reaching the market, and that two-thirds of global aquaculture grows species fed fishmeal and fish oil.
What the evidence shows. The qualifier “at some farms” signals an outlier, yet readers are left to assume it is the norm. Ratios of that size belong to the 1990s, when Naylor et al. (2000) first raised the alarm in Nature. The industry’s response since then is one of the best-documented efficiency gains in modern food production.
In 1990, about 90% of the ingredients in Norwegian salmon feed were of marine origin; by 2013 the share was around 30% (Ytrestøyl et al., 2015, Aquaculture). Between 2010 and 2013, Norwegian salmon production grew by 30% while the total amount of marine ingredients used fell from 544,000 to 466,000 tonnes. By 2020, the 1.98 Mt of feed ingredients used to produce 1.47 Mt of Norwegian salmon were 22.4% marine and 73.1% vegetable (Aas et al., 2022, Aquaculture Reports). Part of that marine fraction is not whole fish at all, but trimmings from fish already processed for human consumption, a point the sector now reports openly, as the Global Salmon Initiative’s latest sustainability report shows.
Figure 1. Share of marine ingredients (fishmeal and fish oil) in Norwegian salmon feed. The 1990 and 2013 values are approximate, as reported by the authors. Sources: Ytrestøyl et al. (2015); Aas et al. (2022).
Kok et al. (2020), in the journal Aquaculture, recalculated the Fish In : Fish Out (FIFO) ratio using economic allocation, the standard method in life-cycle assessment. Their result: global fed aquaculture produces three to four times as much fish as it consumes, and salmon and trout, the most marine-dependent groups, are net neutral. Naylor et al. (2021), revisiting their own landmark paper twenty years later in Nature, concluded that gains in feed efficiency and fish nutrition have lowered the fish-in–fish-out ratio for all fed species. The authors who launched the fishmeal critique now document its correction, a body of work the New York Times piece does not engage.
The “two-thirds” figure deserves the same scrutiny. The remaining third of aquaculture, mostly filter-feeding carps, bivalves and seaweed, requires no external feed at all, a point Urbina’s own companion article acknowledges. Among fed species, being fed fishmeal is not the same as depending on it: in most diets for tilapia, carp, catfish and shrimp, marine ingredients are now a minor inclusion.
Claim 3: A fifth of the world’s catch is diverted from people to feed
What the article says. It reports that a fifth of all fish pulled from the oceans now goes to uses other than human consumption, mostly fishmeal and fish oil, implying a large and growing drain on food that could feed people.
What the evidence shows. The meaning of that figure depends on the denominator, which the article does not supply. Measured against total aquatic animal production, FAO reports that 11%, about 21 Mt, went to non-food uses in 2024, and the remaining 89% went directly to human consumption.
An increasing share of fishmeal and fish oil does not come from whole fish at all. By-products, meaning the heads, frames, viscera and trimmings left after processing fish for people, supplied 34% of global fishmeal and 54% of global fish oil in 2024, according to IFFO’s analysis of SOFIA 2026 data. Each tonne of salmon, tuna or pangasius trimmings converted into feed is a tonne of nutrients recovered from what would otherwise be waste.
The whole fish that are reduced come largely from a small number of bony, oily pelagic species, such as Peruvian anchoveta, menhaden and sandeel, whose direct markets for human food are limited and whose fisheries are among the most closely monitored in the world. These fisheries face their own challenges, as the recent crisis in Peru’s anchovy fishery showed, but those challenges are managed through quotas, closures and stock assessment, not ignored.
Claim 4: Dangerous chemicals end up in farmed seafood
What the article says. It warns that antimicrobials, fire retardants and anesthetics are often added to fish ponds and make their way into the seafood that reaches American supermarkets and restaurants.
What the evidence shows. The article treats aquaculture as a single practice and does not distinguish between unregulated operations and the regulated, residue-tested farms that supply most export markets. Antibiotic use in salmon farming is the clearest example. In Norway, the world’s largest producer of Atlantic salmon, sales of antibacterial drugs for fish farming fell by roughly 99% between 1987 and 1996, after vaccines against furunculosis and vibriosis were adopted across the industry (Markestad and Grave, 1997, Developments in Biological Standardization). Production multiplied over the same period. Where antimicrobial misuse persists, it is a regulatory failure in particular jurisdictions, and the tools to correct it are known.
For consumers, the decisive question is the balance of risk and benefit. In a review of two decades of studies published in JAMA, Mozaffarian and Rimm (2006) found that eating one to two servings of fish a week, especially species rich in the omega-3 fatty acids EPA and DHA such as salmon, reduced the risk of coronary death by 36% and total mortality by 17%. They concluded that the risks from contaminants at typical exposure levels are small by comparison. An article that steers readers away from farmed fish on the strength of trace contaminants may do more harm to public health than the contaminants themselves, a contrast this magazine has also drawn with the food safety record of terrestrial agriculture.
One to two servings of fish a week reduced the risk of coronary death by 36%. Avoiding farmed fish over trace contaminants may cost more health than it protects.
Claim 5: Aquaculture drives food insecurity in poorer countries
What the article says. Drawing on reporting in Senegal, The Gambia and Mauritania, the investigation links fishmeal factories to the loss of affordable local fish, displaced artisanal fishers and pollution in coastal communities, and presents this as a hidden cost of the farmed seafood eaten in wealthy countries.
What the evidence shows. This is the article’s strongest material, and an honest response must acknowledge it. Cashion et al. (2017), in Fish and Fisheries, estimated that most of the fish reduced to meal and oil belong to food-grade species. In West Africa, where sardinella and bonga are an inexpensive and essential source of protein, competition between reduction plants and local markets affects real people.
The article, however, misidentifies the cause. The West African cases it describes stem from weak licensing, under-reported catches, foreign fleets operating with little oversight and lax environmental enforcement around processing plants. These are failures of fisheries governance, and Hilborn et al. (2020) show that such failures are reversible where science-based management is applied. The remedy is stronger regulation of reduction fisheries, traceability and independent certification of marine ingredients, and the shift toward by-products and novel feed ingredients that is already under way.
Aquaculture is also one of the main engines of food security in developing nations. Naylor et al. (2021) found that inland aquaculture, especially in Asia and largely of low-trophic, low-fishmeal species, has contributed the most to global production volumes and to food security over the past two decades. Urbina’s companion article itself acknowledges that fish farming has lowered fish prices for low-income households in Bangladesh and created jobs, particularly for women, in India.
What the article leaves out
Nutrition. Golden et al. (2021), published in Nature as part of the Blue Food Assessment, modeled global food systems to 2030. A scenario adding 15 Mt of aquatic food supply, driven largely by investment and innovation in aquaculture, would lower aquatic food prices by 26% and prevent roughly 166 million cases of inadequate micronutrient intake.
Environmental footprint. Gephart et al. (2021), also in Nature, produced the most comprehensive standardized comparison of aquatic foods to date, covering greenhouse gas emissions, nitrogen, phosphorus, freshwater and land use. Hilborn et al. (2018), reviewing 148 life-cycle assessments in Frontiers in Ecology and the Environment, compared animal proteins per unit of protein produced. Their findings are summarized in Table 1.
| Production system | Environmental performance | Source |
|---|---|---|
| Farmed bivalves and seaweed | Lowest environmental stressors of all aquatic foods assessed | Gephart et al. (2021) |
| Farmed salmon, trout, fed carps, catfish and tilapia | Similar to or better than chicken across the stressors assessed | Gephart et al. (2021) |
| Mollusc aquaculture and small pelagic fisheries | Lowest impact per unit of protein among animal-source foods | Hilborn et al. (2018) |
| Salmon aquaculture | Close behind molluscs and small pelagic fisheries | Hilborn et al. (2018) |
| Beef production and catfish aquaculture | Highest impact per unit of protein among the systems assessed | Hilborn et al. (2018) |
Table 1. Environmental performance of animal protein production systems in two peer-reviewed comparative studies. Prepared by Aquaculture Magazine with information from Gephart et al. (2021) and Hilborn et al. (2018).
Trajectory. The same scientists who were most critical of the sector in 2000 now describe it as expanding in a broadly more sustainable direction, while naming the challenges that remain: disease, pollution, climate change and growing dependence on land-based feed crops (Naylor et al., 2021). That is the balanced picture the article’s readers did not receive.
What it means for the aquaculture industry
- Report your feed metrics with the same rigor as the science: Fish In : Fish Out, the share of marine ingredients from by-products and the certification status of each marine source.
- Treat the West African cases as a supply-chain risk, not a public-relations problem: ask feed suppliers for vessel-level traceability and independent certification.
- When the sector is criticized, answer with numbers and peer-reviewed sources, and acknowledge the problems that are real.
Limits: global averages conceal wide variation between species, countries and companies; the figures in this article describe the sector as a whole, not every operation.
Conclusion
The debate over aquaculture and overfishing deserves better evidence than the article offers. Aquaculture has real problems, and investigative journalism that exposes forced labor, illegal fishing or toxic dumping performs a public service. The industry should take that scrutiny seriously and act on it. The article’s central conclusion, that farmed seafood is worsening the crisis it was meant to solve, does not follow from its own evidence. It presents worst-case ratios as typical, quotes statistics without the denominators that change their meaning, attributes failures of fisheries governance to fish farming and omits the peer-reviewed literature that measures the sector’s progress.
Aquaculture now produces more aquatic animals than all the world’s fishing fleets combined. Its dependence on wild fish per kilogram produced has fallen sharply for three decades, and a third of its output requires no feed at all. The way forward is better governance of reduction fisheries and continued innovation in feed, not a narrative that steers consumers away from one of the most efficient sources of animal protein available. Table 2 summarizes each claim against the evidence.
| Claim in the article | What the evidence shows | Source |
|---|---|---|
| Aquaculture makes overfishing worse | Aquaculture supplied 103 Mt (53%) of aquatic animals in 2024; wild catch flat at about 92 Mt | FAO SOFIA 2026 |
| One-third of stocks are overfished | 72.6% of global landings come from sustainable stocks; managed stocks are, on average, at target levels | FAO SOFIA 2026; Hilborn et al. (2020) |
| A salmon eats six times its weight in wild fish | Fed aquaculture produces 3 to 4 times the fish it consumes; salmon and trout are net neutral | Kok et al. (2020); Naylor et al. (2021) |
| Salmon feed depends on wild fish | Marine share of Norwegian salmon feed fell from about 90% (1990) to 22.4% (2020) | Ytrestøyl et al. (2015); Aas et al. (2022) |
| A fifth of the catch goes to feed | 11% of total aquatic animal production is non-food; 34% of fishmeal comes from by-products | FAO SOFIA 2026; IFFO |
| Chemicals make farmed fish unsafe | Norwegian antibacterial use fell about 99% (1987–1996); fish intake cuts coronary death by 36% | Markestad and Grave (1997); Mozaffarian and Rimm (2006) |
| Farmed fish harm the planet | Farmed salmon, trout, carp and tilapia match or beat chicken; bivalves and seaweed have the lowest impact | Gephart et al. (2021); Hilborn et al. (2018) |
Table 2. Claims in the New York Times article compared with FAO statistics and peer-reviewed evidence. Prepared by Aquaculture Magazine.
Frequently asked questions
Does aquaculture make overfishing worse?
Global data do not support that conclusion. Aquaculture produced 103 Mt of aquatic animals in 2024, 53% of the total, while wild catch has stayed near 90 Mt for three decades (FAO SOFIA 2026). Stock health depends mainly on fisheries management (Hilborn et al., 2020).
How much wild fish does a farmed salmon eat?
Far less than in the 1990s. Marine ingredients made up 22.4% of Norwegian salmon feed in 2020, down from about 90% in 1990, and economic Fish In : Fish Out estimates show salmon and trout farming as net neutral (Aas et al., 2022; Kok et al., 2020).
How much fishmeal comes from fish processing by-products?
By-products such as heads, frames and trimmings supplied 34% of global fishmeal and 54% of global fish oil in 2024, according to IFFO’s analysis of FAO SOFIA 2026 data.
Is farmed fish safe to eat?
For most people, the benefits outweigh the risks. One to two servings of fish a week reduced the risk of coronary death by 36% and total mortality by 17% (Mozaffarian and Rimm, 2006). In Norway, antibacterial use in fish farming fell about 99% between 1987 and 1996 after vaccination was adopted.
Is the concern about fishmeal in West Africa valid?
Partly. Most fish reduced to meal belong to food-grade species (Cashion et al., 2017), and in West Africa reduction competes with local markets. The cause is weak fisheries governance, which stronger regulation, traceability and certification can correct.
Sources and Methodology
Content type: editorial analysis by Aquaculture Magazine. Disclosure: Aquaculture Magazine is a trade publication whose advertisers include feed, nutrition and aquaculture companies; no company commissioned or sponsored this article. Note on the data: the claims attributed to the New York Times are paraphrased from the article published online on October 8, 2026 and from the companion reporting by The Outlaw Ocean Project. Global figures come from FAO and are reported in live-weight equivalent.
References
Aas, T.S., Åsgård, T. & Ytrestøyl, T. (2022). Utilization of feed resources in the production of Atlantic salmon (Salmo salar) in Norway: An update for 2020. Aquaculture Reports, 26, 101316. doi:10.1016/j.aqrep.2022.101316
Cashion, T., Le Manach, F., Zeller, D. & Pauly, D. (2017). Most fish destined for fishmeal production are food-grade fish. Fish and Fisheries, 18(5), 837–844. doi:10.1111/faf.12209
FAO (2026). The State of World Fisheries and Aquaculture 2026. Rome: FAO.
Gephart, J.A., Henriksson, P.J.G., Parker, R.W.R., et al. (2021). Environmental performance of blue foods. Nature, 597, 360–365. doi:10.1038/s41586-021-03889-2
Golden, C.D., Koehn, J.Z., Shepon, A., et al. (2021). Aquatic foods to nourish nations. Nature, 598, 315–320. doi:10.1038/s41586-021-03917-1
Hilborn, R., Banobi, J., Hall, S.J., Pucylowski, T. & Walsworth, T.E. (2018). The environmental cost of animal source foods. Frontiers in Ecology and the Environment, 16(6), 329–335. doi:10.1002/fee.1822
Hilborn, R., Amoroso, R.O., Anderson, C.M., et al. (2020). Effective fisheries management instrumental in improving fish stock status. PNAS, 117(4), 2218–2224. doi:10.1073/pnas.1909726116
IFFO (2026). The State of World Fisheries and Aquaculture 2026: analysis through a marine ingredients lens.
Kok, B., Malcorps, W., Tlusty, M.F., et al. (2020). Fish as feed: Using economic allocation to quantify the Fish In : Fish Out ratio of major fed aquaculture species. Aquaculture, 528, 735474. doi:10.1016/j.aquaculture.2020.735474
Markestad, M. & Grave, K. (1997). Reduction of antibacterial drug use in Norwegian fish farming due to vaccination. Developments in Biological Standardization, 90, 365–369.
Mozaffarian, D. & Rimm, E.B. (2006). Fish intake, contaminants, and human health: Evaluating the risks and the benefits. JAMA, 296(15), 1885–1899. doi:10.1001/jama.296.15.1885
Naylor, R.L., Goldburg, R.J., Primavera, J.H., et al. (2000). Effect of aquaculture on world fish supplies. Nature, 405, 1017–1024. doi:10.1038/35016500
Naylor, R.L., Hardy, R.W., Buschmann, A.H., et al. (2021). A 20-year retrospective review of global aquaculture. Nature, 591, 551–563. doi:10.1038/s41586-021-03308-6
Urbina, I. (2026, October 8). The dirty secret behind the farmed fish you eat. The New York Times Magazine.
Urbina, I. (2026, October 9). The price paid beyond the plate: the huge costs of farmed seafood. Daily Maverick / The Outlaw Ocean Project.
Ytrestøyl, T., Aas, T.S. & Åsgård, T. (2015). Utilisation of feed resources in production of Atlantic salmon (Salmo salar) in Norway. Aquaculture, 448, 365–374. doi:10.1016/j.aquaculture.2015.06.023
Aquaculture Magazine is an English-language trade publication covering the global aquaculture industry, with technical articles, news and analysis for producers, nutritionists and suppliers, at aquaculturemag.com.
Apa Reaksi Anda?
 Suka
0
 Kurang Suka
0
 Setuju
0
 Tidak Setuju
0
 Bagus
0
 Berguna
0
 Hebat
0